Quality Framework

Updated Framework
We have refreshed the domains of the Quality Framework and added in more detail covering equality, diversity and inclusion along with more information on working with Integrated Care Systems.
The new Framework is available to complete via Smart Survey, to make it quicker and easier for you to complete.
How it can help?
- Understand where your work is currently effective and where you can make improvements
- Informs local authorities on how to commission and monitor an effective Healthwatch
- Enables Healthwatch England to identify where further help is needed by individual Healthwatch and how we can improve the support and training we provide.
Quality Framework domains
- Leadership and Decision Making: This looks at the importance of having clear goals and a rationale for your work. It also looks at the strength of your leadership and governance, both of which are key to successfully navigating a complex environment whilst maintaining independence and accountability.
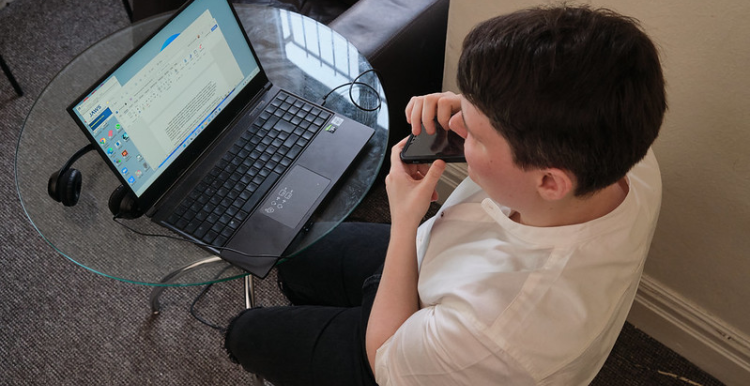
- People: This recognises the importance of staff and volunteers. It can help you understand whether your board, staff and volunteers have the right knowledge, skills and support to deliver an effective, consistent service.
- Sustainability and Resilience: This focuses on a business model that enables you to plan and operate effectively, as well as adapting to the changing needs of communities.
- Collaboration: This recognises the value of working in partnership, and of learning from other Healthwatch.
- Engagement, Involvement and Reach: This focuses on our main statutory activities. It looks at how you go about reaching out to all sections of your community, gathering people’s views, providing advice and information, and involving people in your work.
- Influence and Impact: This focuses on our purpose by looking at the difference you make by ensuring those in charge of health and care services hear and act on people's views.
View the Quality Framework online
You can view the six Smart Survey questionnaires for each domain and work your way through answering them here on the network site.
Using the Quality Framework
Why not sign up to use the Quality Framework? If you get involved, we will offer you 1-2-1 support and talk through any guidance or training needs you have as a result of completing the Framework.
If you have already started working through the previous Excel spreadsheet, we will continue to offer you support to complete the Framework this way, however we recommend people starting out use the simplified Smart Survey version.
Please get in touch with Delana Lawson if you are interested in learning more.
Downloads
Printable versions
We have produced printer-friendly versions of the survey questions for each of the six domains to allow you to discuss them with your teams and draft answers before inputting your final answers into Smart Survey.